
Guide YouTube Analytics : Analyser les données de votre chaîne
Découvrez comment utiliser et analyser les données de Youtube Analytics pour suivre les performances de vos vidéos et de votre chaîne YouTube pour atteindre vos objectifs
August 22, 2025

Aborder YouTube Analytics ne devrait pas virer à l'obsession. C'est en identifiant les bons indicateurs de performance et en les mettant au coeur de votre stratégie que votre chaîne gagnera en pertinence, sans vous perdre dans un océan de données.
Selon une récente étude d'Hubspot, 77 % des spécialistes du marketing ont adopté YouTube pour booster la visibilité de leur marque. Certes, investir dans le contenu vidéo sur la plateforme peut s'avérer plus onéreux que sur d'autres réseaux sociaux, mais l'enjeu en vaut la chandelle si l'on sait optimiser ses ressources. C'est pourquoi une compréhension aiguisée de YouTube Analytics est capitale. Vous pourrez en effet vous baser sur des données tangibles pour analyser la manière dont votre audience interagit avec votre contenu, et prendre les bonnes décisions pour orienter votre stratégie en conséquence.
Dans cet article, nous vous présentons les principales fonctionnalités de l'outil et les métriques à prioriser, vous permettant d'ajuster votre contenu à l'aune des interactions de votre audience et de propulser votre chaîne YouTube vers de nouveaux sommets.
Comment avoir accès à YouTube Analytics ?
YouTube Analytics est la console de suivi des métriques de votre chaîne. Il est accessible via le site web de Youtube et une application mobile spécifique.
Pour accéder à YouTube Analytics depuis votre ordinateur :
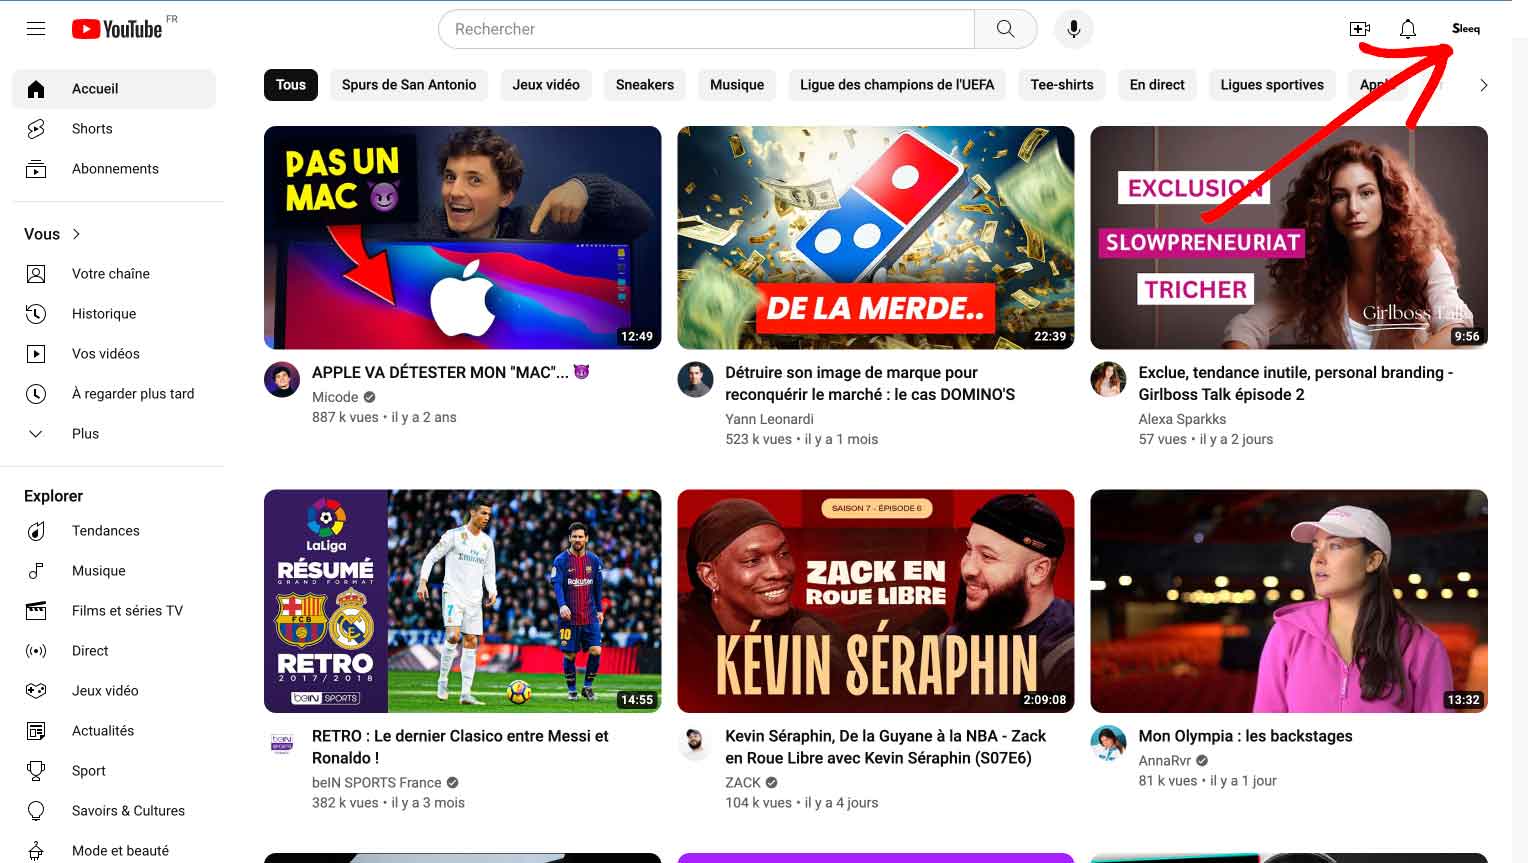
1. Connectez-vous à votre compte YouTube et cliquez sur l'icône de votre profil dans le coin supérieur droit de l’écran ;
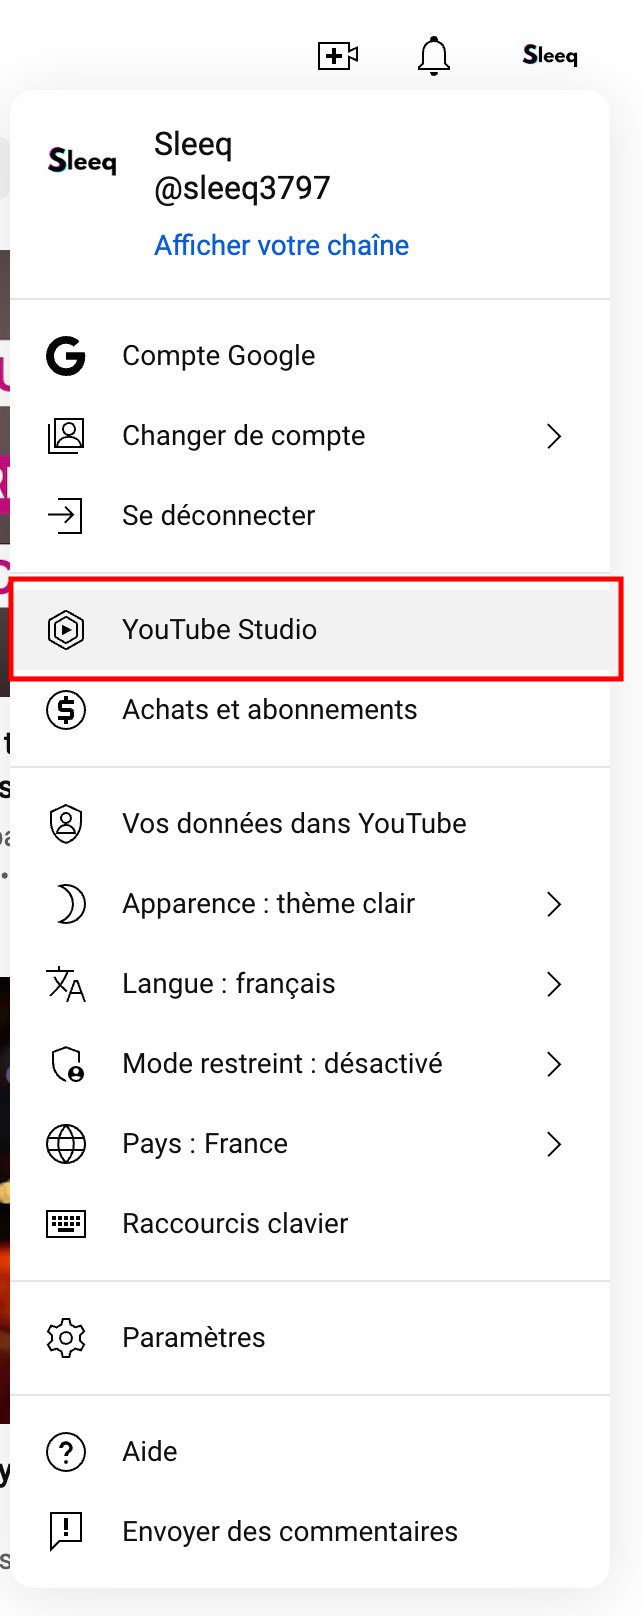
2. Sélectionnez YouTube Studio.
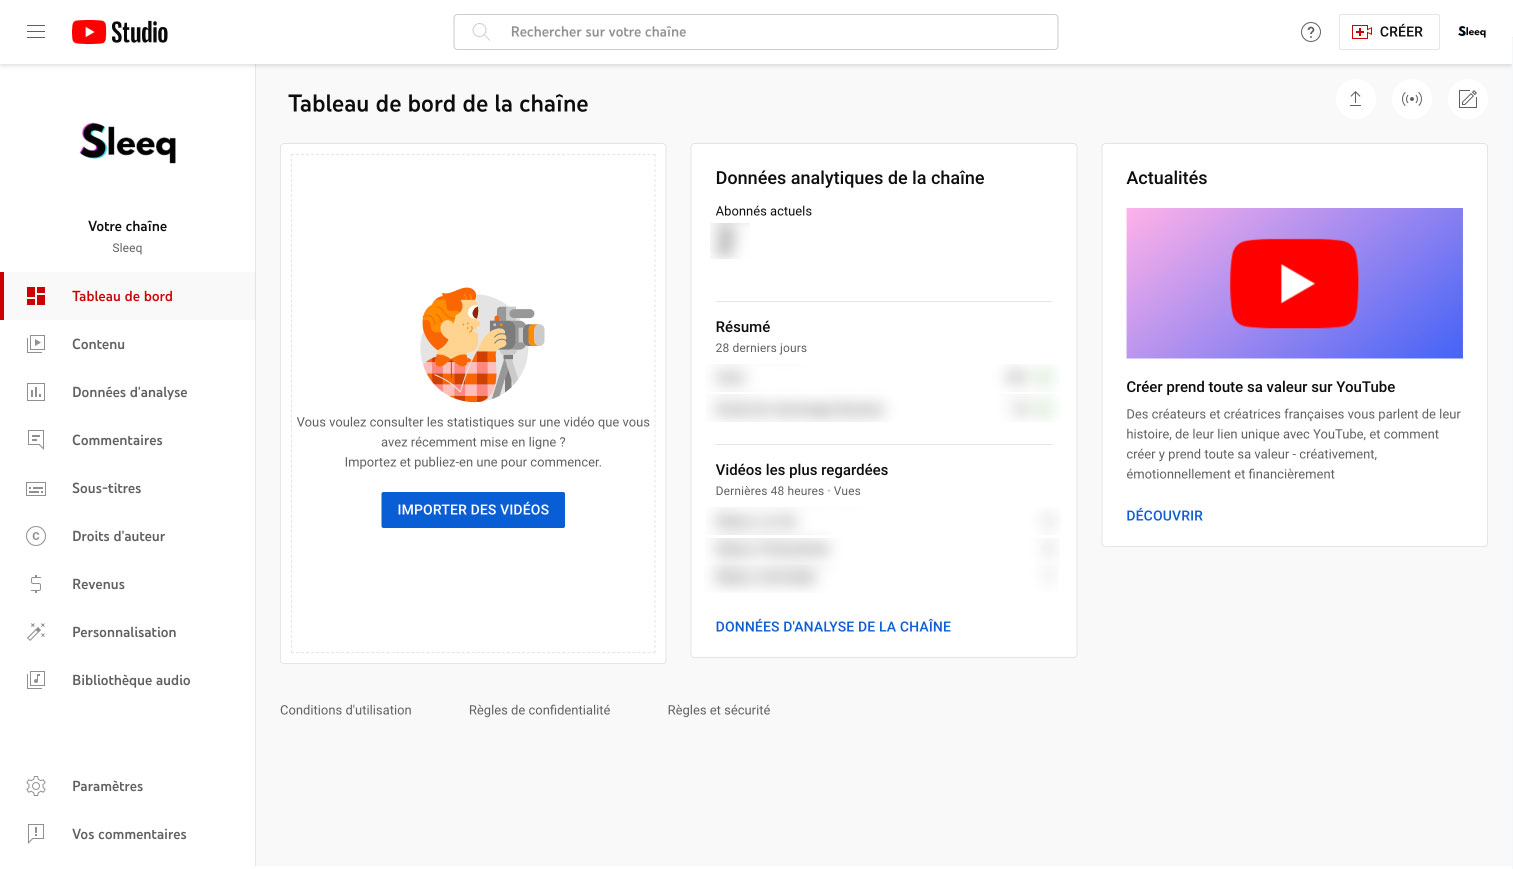
3. Bienvenue dans votre tableau de bord d'analyses marketing YouTube.
4. Sélectionnez le Mode avancé dans le coin supérieur droit. Cela vous donnera accès à une ventilation détaillée des métriques de votre chaîne YouTube, de chacune de vos vidéos ainsi que des analyses plus détaillées (comme la source de trafic, la localisation de votre audience, leur âge, sexe, etc.)
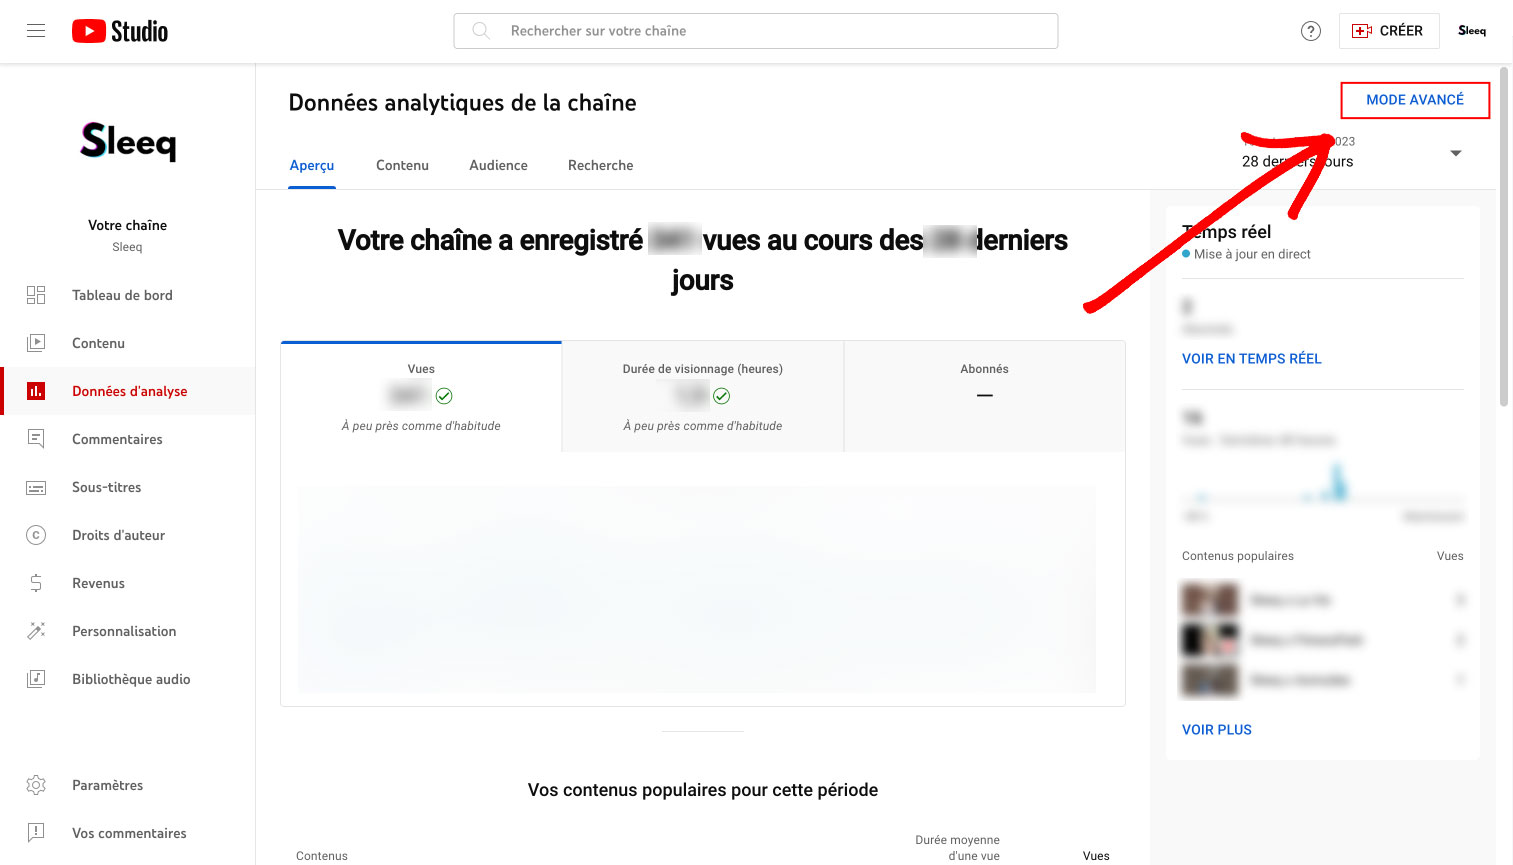
4. Téléchargez un rapport de vos métriques YouTube. Choisissez les paramètres que vous souhaitez suivre en mode avancé. Ensuite, cliquez sur la flèche pointant vers le bas dans le coin supérieur droit. Choisissez Google Sheets ou un fichier .csv pour générer votre rapport.
Pour accéder à YouTube Analytics depuis votre smartphone :

Tout d'abord, vous devez d’abord avoir installé YouTube Studio sur votre téléphone.
1. Ouvrez YouTube Studio et connectez-vous à votre compte.
2. Cliquez sur Analytics pour accéder à quelques métriques récapitulatives sur le tableau de bord principal.
3. Consulter en haut de votre écran, les différents onglets – Recherche, Présentation, Contenu, Audience – selon les données spécifiques que vous souhaitez connaître.
Comment utiliser les données pour améliorer votre chaîne YouTube ?
Pour réussir sur YouTube, il faut trouver le juste milieu : il n'est pas nécessaire de faire une fixette sur chaque chiffre, mais les négliger, c'est avancer à l'aveugle. Avec toutes les données que les réseaux sociaux nous offrent, il en devient un vrai casse-tête de savoir sur quoi nous devons vraiment nous pencher. Certains vous donnent une perspective superficielle, tandis que d'autres, comme le temps de visionnage, le taux de clics (CTR) et les taux de rétention, offrent des insights plus fins et plus stratégiques.
Une utilisation avisée des YouTube Analytics vous permettra non seulement de :
- Comprendre les préférences de l'audience : Utilisez les analyses YouTube pour déceler ce qui résonne le plus avec vos viewers.
- Affiner la qualité et le format : Ajustez la production de vos vidéos en fonction des retours analytiques pour améliorer l'engagement.
- Calendrier de publication : Planifiez vos publications selon les habitudes de visionnage de votre public pour maximiser la portée.
- Optimisation du référencement : Améliorez le SEO de vos vidéos pour une meilleure visibilité sur YouTube.
- Augmenter le trafic via les CTA : Rédigez des appels à l'action incisifs et des descriptions attrayantes pour diriger le trafic vers d'autres plateformes ou canaux de communication.
Les outils analytiques de YouTube sont des alliés précieux pour saisir les attentes de vos abonnés et identifier des améliorations ciblées. Ils sont la clé pour captiver et retenir leur attention plus durablement.

Les données importantes à suivre pour sa chaîne YouTube
De nombreuses données sont disponibles dans YouTube Analytics. Parmi celles sur lesquelles vous ne pouvez pas faire l’impasse, il y a :
1. Le Watch Time
La durée de visionnage correspond au nombre total de minutes que les spectateurs ont passées devant vos vidéos. Il s’agit d’une mesure clé car l’algorithme de YouTube suppose qu’une durée de visionnage plus importante est un bon signal de qualité du contenu. Il mettra donc plus en avant les vidéos et les chaînes avec une durée de visionnage plus élevées.
Dans le rapport de Watch Time de Youtube Analytics, vous pouvez voir la durée de visionnage accumulée par vos vidéos. Mais il est également possible de les classer par durée de visionnage en les regroupant par thème.
2. Le pourcentage moyen visionné
Le pourcentage moyen visionné correspond au pourcentage de chaque vidéo que le spectateur moyen a regardé. Cette donnée mesure donc la capacité de votre vidéo à retenir l’attention des spectateurs dans son intégralité.
Or lorsque YouTube considère que vos vidéos sont en mesure de retenir l’attention des utilisateurs, il les fait remonter dans les classements de recherche et dans les recommandations.
3. La durée moyenne de visionnage
La durée moyenne de visionnage correspond à la durée totale de visionnage de votre vidéo divisée par le nombre total de lectures (y compris les revisinonages). Cette métrique mesure la capacité de votre vidéo à engager les utilisateurs.
Si votre vidéo ne parvient pas à engager les spectateurs, ils rebondiront rapidement sur votre vidéo (en regardant un autre contenu ou même en quittant la plateforme). Cela risque donc de nuire à la visibilité de votre chaîne sur YouTube.
4. Le taux de revisionnage
Les revisionnages correspondent au nombre de fois où les spectateurs revoient certaines parties de votre vidéo. Si de nombreuses personnes regardent à nouveau une partie spécifique de votre vidéo, cela indique qu’elles sont probablement intéressées par le sujet abordé à ce moment-là.
Vous pouvez trouver ces données dans le graphique de rétention absolue de l’audience. Les re-visionnages sont généralement indiquées par des courbes ascendantes sur le graphique.
5. Les métriques d'engagement
Les commentaires, les partages, les likes et les dislikes vous donnent de précieuses indications sur la qualité de votre contenu et son adéquation avec les attentes de votre cible. Vous pourrez ainsi déterminer quels sujets fonctionnent le mieux auprès de votre public ou même puiser de nouvelles idées de contenu/format dans les commentaires laissés par les utilisateurs.
6. Le taux de clic sur les impressions
Le taux de clic sur les impressions mesure la capacité de votre vidéo à inciter les utilisateurs à la regarder après l'avoir vue sur leur page d'accueil, leur section de recommandations ou dans l’onglet des tendances. Un taux de clic élevé signifie que votre titre était convaincant et que le sujet de votre vidéo trouve un écho auprès de nombreuses audiences pertinentes sur YouTube.
Performer grâce à l’analyse des données YouTube
En fin de compte, l'analyse des données YouTube ne se limite pas à la collecte de statistiques et à la surveillance de graphiques fluctuants ; c'est un art stratégique qui, lorsqu'il est maîtrisé, peut transformer la visibilité de vos vidéos et de votre chaîne YouTube. L'utilisation judicieuse de YouTube Analytics peut élever la qualité de vos vidéos, renforcer votre stratégie de contenu en fonction des préférences de votre audience, à optimiser votre SEO par des mots-clés pour plus de visibilité et à ajuster vos stratégies de publication pour maximiser l'impact.
Investissez du temps pour maîtriser YouTube Analytics et transformer les insights en actions concrètes. Ainsi, chaque vidéo deviendra une opportunité d'engager davantage votre public et d'atteindre vos objectifs marketing et commerciaux plus efficacement.


.avif)